Plotting Sheets and Harbor Charts
|
John Ellsworth tells how to make your own.
|
|
First appeared in SAIL magazine • All rights reserved • © 2006 John Ellsworth
|
Unlike a conventional nautical chart, a plotting sheet is virtually blank. It has only a specific range of latitude lines, a set of unlabeled longitude lines, and if it's preprinted it will have a compass rose. But bare as it may be, the plotting sheet is an invaluable tool whether you've just started studying navigation or you are a seasoned navigator.
A plotting sheet can be used for working out practice navigation problems, maintaining an actual DR track, and, if you navigate by the sun and the stars, for plotting celestial lines of position. Furthermore, when you use a plotting sheet, you avoid marking up your regular chart.
Plotting sheets are printed by the US Naval Defense Mapping Agency Hydrographic center. The Universal Plotting Sheet costs $1.50 for a pad of 50. There is also a 3000S series for $.50 apiece and a larger Z series that cost $1.50 each.
But also you can make your own plotting sheets quite easily. And even if you normally use the preprinted sheets you should know how to construct your own sheet. A prelined piece of notebook paper is a good place to start.
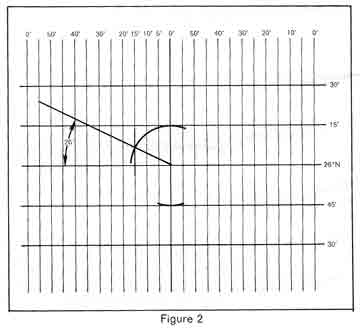
To construct a plotting sheet, first turn a piece of notebook paper on its side. Label the vertical lines, which now will represent meridians, at any desired interval - 1' (which equals one mile), 2', 5', or whatever you prefer. Draw a line across the center of the sheet that is perpendicular to the other lines. This line will represent your midlatitude, or that parallel of latitude which passes through the center of your area of interest. In this case we have used 26' (Fig. 1).
Draw a diagonal line with a 26' angle to the mid-latitude line at the intersection of the central meridian. Remember the angle must always be equal to the degrees of the mid-latitude line.
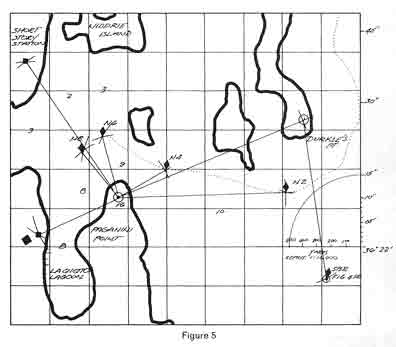
The length of the diagonal between two meridians that are 15' apart, for example, will be the same length as 15' of latitude. Therefore, transfer this distance by swinging an arc and use this same distance to space off as many other 15' parallels as you need (Fig. 2).
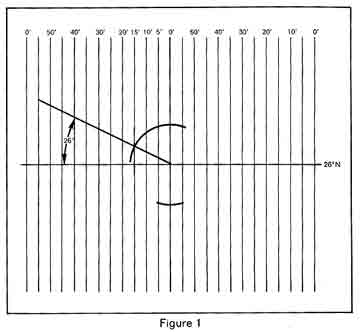
Always use the diagonal for your scale for it is graduated already. The length between each 5' meridian crossing is going to equal five nautical miles and therefore this scale may serve both as a latitude and a mile scale (Fig. 3).
Since this plotting sheet does not have a compass rose, although true north is going to be parallel to the central meridian line, you must use a course plotter or course protractor for plotting. And don't forget to include the proper variation for the area. The amount of variation will be shown on the official nautical chart.
To illustrate to you why the center horizontal line always should represent the mid-latitude point, consider a large area that is represented on a small-scale chart: the Gulf of Mexico, for example. You may be at Cozumel, just off the coast of the Yucatan Peninsula, and you wish to sail to Tampa, Florida. You plot a track of 028' from Cozumel (at latitude 20' 30' N) to Tampa Bay (at 270 45' N). By setting your dividers at 60 nautical miles, measured at the mid-range latitude scale (about 23' 30' N), and walking them from Cozumel to Tampa Bay, you get a total distance of 490 miles, But had you set your dividers at the latitude scale adjacent to Cozumel, you would have measured 502 miles. And if you had used the scale off Tampa Bay, you would have gotten 477 miles. As you see, the farther from the equator, the greater the distance between parallels. This distance difference occurs when the earth's flattened shape at the poles is converted to a flat surface. However, by using a latitude line at the midpoint, you can adjust for this distortion quite accurately.
Although a preprinted plotting sheet must be used within specified latitudes, it can be used at any longitude and of course may be inverted for waters in the Southern Hemisphere.
You can make a large-scale harbor chart with almost the same ease as you can fabricate a plotting sheet. You might want to increase the scale of a harbor that exists only on a small-scale chart. First, carefully review the harbor area on your coastal chart and determine whether or not it has enough necessary aids to navigation, soundings, etc. to enter safely. If the necessary information is there, you can make a large-scale workable harbor chart right from the small-scale coastal chart.
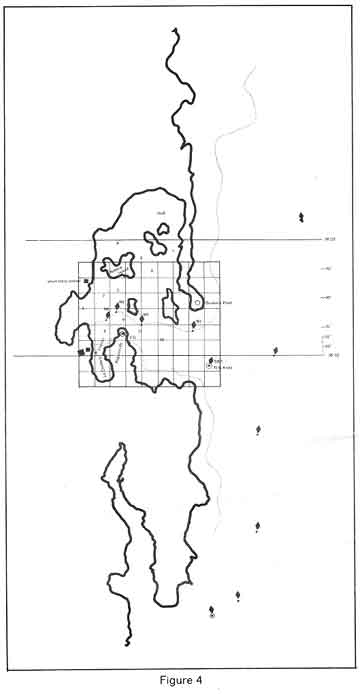
After you have reviewed the harbor area, rule a grid of equal squares over the harbor on the coastal chart (Fig. 4). Decide how much larger you want the chart to be, and, on a plain sheet, draw a second grid that is many times greater in scale. For example, if each grid box on the coastal chart is a 1/4" square, and you wish to enlarge the area by four times, draw your second grid with one-inch squares. (In doing so, you will be changing a 1:40,000 scale to 1:10,000.)
On the second grid, draw a scale of distances and mark it accordingly. Remember, one minute of latitude equals one nautical mile or 2,000 yards.
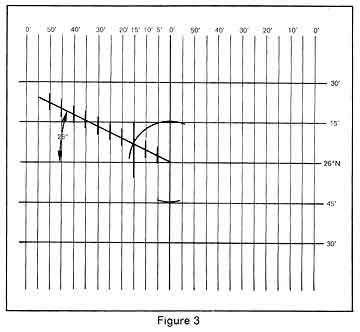
Now, by using the squares on the first grid as guidelines, transfer the shoreline and useful contours from the first grid to the second grid. Also, plot pertinent soundings and aids to navigation by measuring their bearings and/or distances to and from appropriate grid intersections and objects (Fig. 5).
When you're finished, you'll have a large workable harbor chart that will permit you to navigate much more accurately than if you had only the coastal chart. If you want to be a competent navigator, you should know how to make both a plotting sheet and a harbor chart. These charts can be extremely helpful, and, once you know how to do it, their construction is easy.
|
|
|